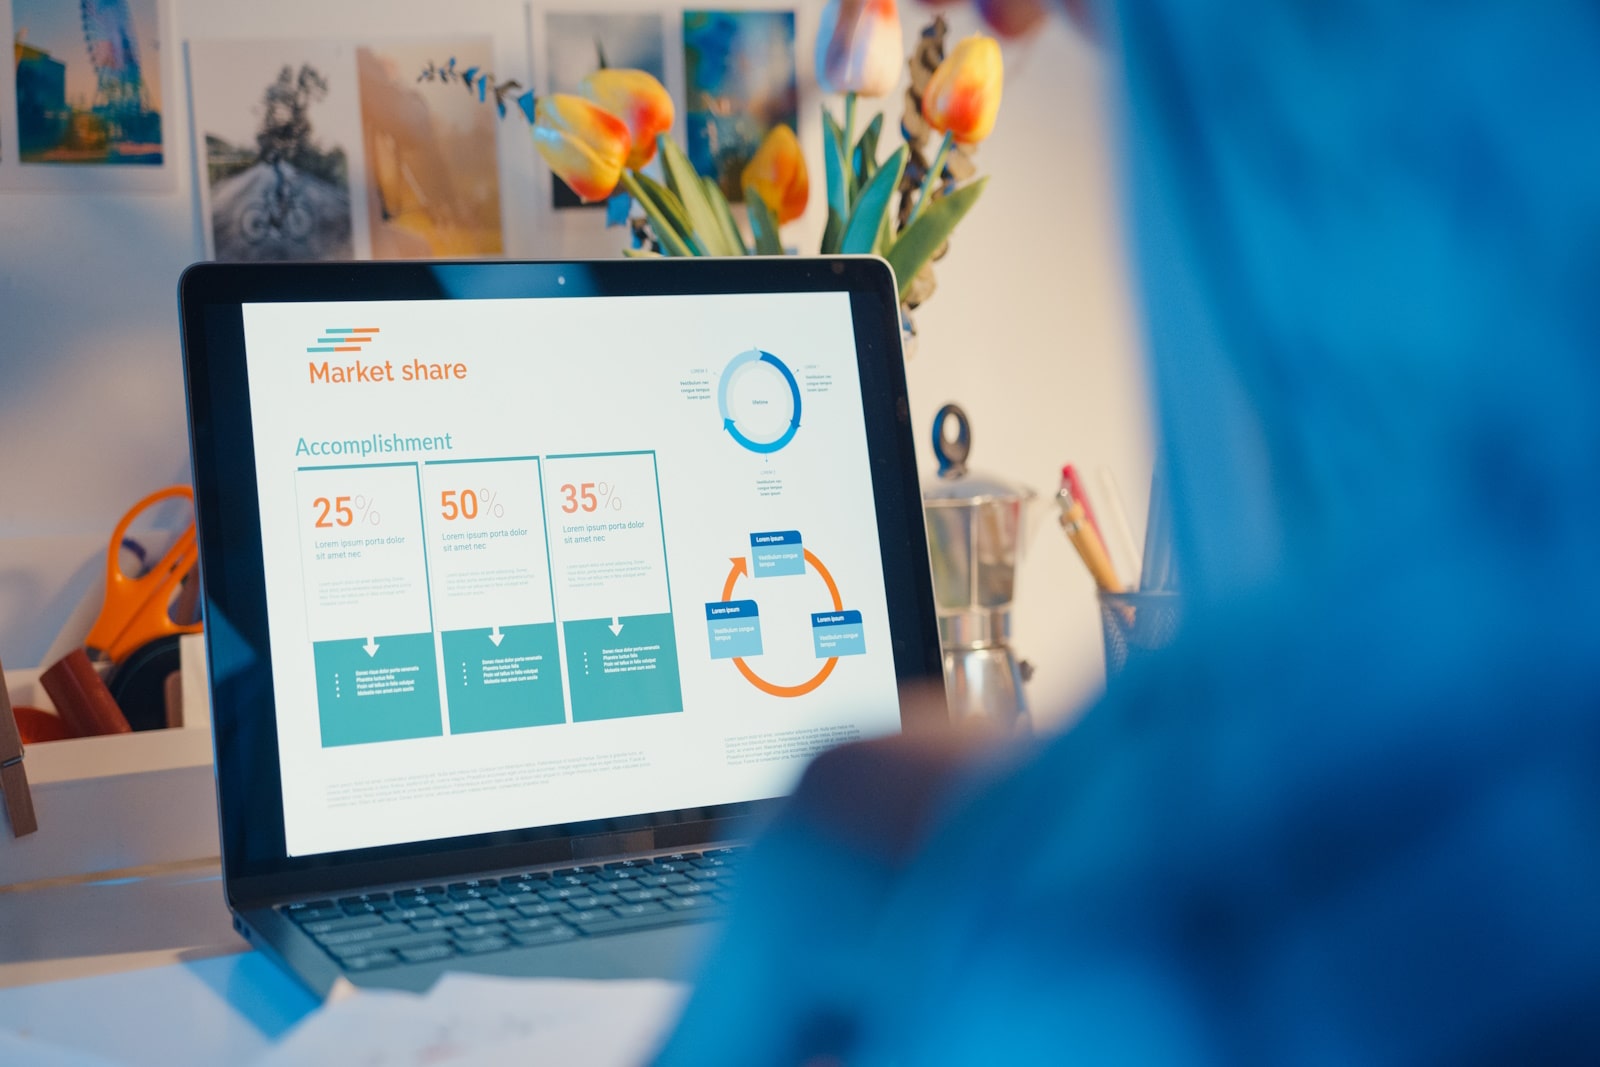
Animated Infographics for Data Storytelling
Large datasets, technical reports, and statistics can easily overwhelm audiences, and traditional presentation methods often fail to convey meaning effectively. Combining animated infographics with whiteboard styles offers a powerful solution, turning raw data into compelling visual stories that audiences can understand, retain, and act upon. Whiteboard animators play a pivotal role in this approach, translating abstract numbers and ideas into dynamic, visually engaging narratives.
By integrating hand-drawn illustrations with motion graphics, they create content that not only informs but also captivates. This synergy of animation and illustration makes complex concepts approachable, enhances memory retention, and increases overall engagement.
The Fundamentals of Animated Infographics and Whiteboard Styles
Animated Infographics are graphics that incorporate movement to illustrate trends, patterns, and relationships in data. Motion allows viewers to see changes over time, emphasise connections, and focus on key insights. For example, animated charts or evolving diagrams can show growth, decline, or correlations more clearly than static images ever could.
Whiteboard Animation involves hand-drawn illustrations that appear to be created in real-time on a whiteboard. This technique enables step-by-step visual explanations, making even the most complex information intuitive and easy to follow. It also provides a sense of storytelling as if someone is walking the viewer through each concept.
When combined, these two techniques allow whiteboard animators to craft immersive, interactive data stories. The combination ensures that both visual learners and narrative-driven audiences find the content engaging and understandable.
The Importance of Data Storytelling
Data storytelling is the process of transforming raw data into a narrative that communicates insights meaningfully. While charts and tables display facts, storytelling adds context and purpose, helping audiences understand the “why” behind the numbers.
Whiteboard animators enhance this process by visually narrating the story, guiding viewers through complex information in an organised, coherent way. The result is content that resonates emotionally and cognitively, making it far more effective than traditional data presentation methods.
Data storytelling can be applied across industries: public health agencies can communicate policy decisions, universities can explain research findings, and businesses can present insights to stakeholders in an engaging, memorable format.
Benefits of Combining Animated Infographics with Whiteboard Styles
1. Simplifying Complex Data
Whiteboard animators specialise in breaking down large datasets into manageable, digestible segments. By visualising key trends and insights, they make intricate information understandable without oversimplifying or losing accuracy.
For instance, an animated infographic can display annual statistics while a whiteboard overlay explains what the numbers mean, why they matter, and how they relate to the audience’s context.
2. Enhancing Audience Engagement
The motion in animated infographics immediately captures attention, while the real-time drawing effect of whiteboard animation keeps viewers invested. This combination ensures audiences remain engaged throughout the story, reducing drop-off rates and increasing comprehension.
3. Improving Retention
Information presented visually is more likely to be remembered. Research shows that audiences retain more knowledge when it is delivered through multisensory experiences, combining narration, illustration, and animation. Whiteboard animators leverage this principle, crafting visuals that reinforce learning.
4. Facilitating Emotional Connection
Numbers alone rarely evoke emotion. Narratives do. Whiteboard animators can transform data points into stories that resonate emotionally, enhancing impact and encouraging audiences to act, whether it’s adopting a new behaviour, supporting a policy, or understanding a complex process.
5. Versatility Across Sectors
This combined approach is highly versatile. Government agencies can explain public policy changes, healthcare organisations can communicate medical data, educational institutions can simplify complex subjects, and businesses can use it for internal training or marketing presentations.
Key Techniques for Whiteboard Animators
Visual Metaphors
Visual metaphors help audiences grasp abstract concepts by connecting them to familiar imagery. Whiteboard animators often use symbols, icons, or hand-drawn objects to represent complex ideas, making them instantly recognisable. For example, a lightbulb can represent innovation, or a tree can signify growth and development.
Transitions and Motion Design
Smooth, purposeful transitions guide viewers through the narrative without confusion. Motion design helps maintain the visual flow, emphasising important points and making complex relationships clear. Whiteboard animators can employ gradual reveals, morphing objects, or sequential drawing to guide understanding effectively.
Audience Engagement Strategies
Keeping viewers invested is key. Whiteboard animators use pacing, humour, and visual emphasis to maintain attention. Elements such as highlighting, magnifying, or animating key points ensure viewers notice and remember critical insights.
Simplifying Without Losing Accuracy
A common challenge is balancing simplicity with accuracy. Whiteboard animators distil complex data into clear, concise visuals that retain essential details. They prioritise the most important information, reducing cognitive load while maintaining credibility.
Accessibility
Effective storytelling is inclusive. Whiteboard animators ensure that colour contrasts, legible text, and optional subtitles or voiceovers make content accessible to a wide audience, including those with visual or auditory impairments.
Best Practices for Whiteboard Animators
- Maintain Consistency – Use a cohesive visual style, font, and colour palette to avoid distraction.
- Focus on Narrative Flow – Guide the viewer logically through data points, building understanding step by step.
- Strategic Emphasis – Highlight key insights with movement, colour, or annotation to ensure clarity.
- Iterative Testing – Test content with sample audiences to ensure it communicates effectively.
- Combine Data with Story – Always contextualise data with a narrative to maximise comprehension and retention.
By following these principles, whiteboard animators create data stories that not only inform but inspire.
Applications of Animated Infographics and Whiteboard Styles
- Government Communication: Explaining public policies, safety guidelines, or budget allocations in an engaging, digestible format.
- Education and Training: Enhancing online learning or classroom instruction by breaking down complex subjects.
- Corporate Communication: Presenting internal reports, quarterly results, or strategic plans in a visually compelling way.
- Public Awareness Campaigns: Making research findings or health initiatives more relatable to the general population.
Across sectors, whiteboard animators are redefining how information is presented, ensuring that audiences not only understand the data but also retain and act on it.
Combining animated infographics with whiteboard styles represents one of the most effective methods for data storytelling today. Whiteboard animators transform complex data into narratives that are easy to follow, emotionally engaging, and highly memorable. By integrating visual metaphors, smooth motion, and narrative flow, this approach ensures audiences understand and retain even the most intricate information.
At Sound Idea Digital, we specialise in bringing your data to life. Our whiteboard animators create customised animations and infographics that capture attention, simplify complexity, and drive engagement. Contact us today to see how our expertise can transform your data storytelling and help your organisation communicate more effectively.


